Workstream Automation
Rapidly decrease time-to-quote and increase time-to-value of technical sellers.
Note: This project is one of my most-visible failures. The funding for the teams went all the way to the CEO with EVP sponsorship. It taught me a great lesson: projects only succeed with the right buy-in and collaboration... They don't exist in a vaccuum, multiple champions are required. It also demonstrated the value of tying a project idea to an internal business workstream, as well as ideas that are good automation candidates, and which are difficult. Potentially more importantly, which projects are bad from an optics perspective...
ABLATE Overview - Status Quo
verb (used with object), ab·lat·ed, ab·lat·ing.
to remove or dissipate by melting, vaporization, erosion, etc.:
to ablate a metal surface with intense heat.
A - Automated B - ‘Blox L - Learning A - Architecture (to) T - Transfer (to) E - Engineering
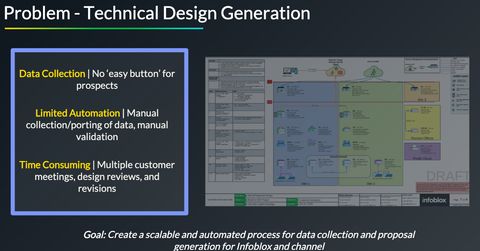
When building a team that services an entire country, spread across a handful of technical sellers, being 'tiny but mighty' and efficient in the proposal generation stages is imperative. To generate timely quotes, accurate technical diagrams need to exist to quote a BOM as well as scope services work. These diagrams are sourced from technical data provided by customers.
In the event a customer doesn't know where to find or how to acquire the data, we were immensely delayed in our processes. At the time, an ongoing company-wide workstream existed to make us easy to do business, and this project aligned to that outcome.
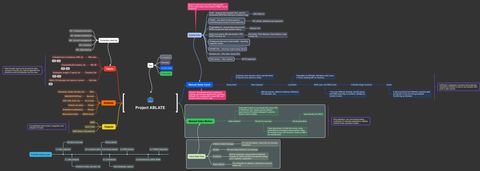
To create a vision to derive slides / actions from, this idea originally existed as a mindmap. Let's examine the components below.
3 Questions Framework
- What is it?
- An analysis engine to automate the architecture diagramming of proposals
- Why does it matter?
- Speeding time-to-quote, increasing customer sentiment regarding ease of doing business, accuracy in best-practice architectures
- How does it work?
- A collection of open and closed source software deployed in public cloud in an existing data pipeline (new customer meetings) to standardize customer experience
Data Sources
Inputs
5 different teams control data used in creating an accurate architecture diagram:
- XML trees: collected from L3 backbone, LLDP, ARP, API, CLI, etc
- Microsoft database: Enumerate for sites and services, AD forests, domains, etc
- Company information: Employees, budget, IT spend, etc
- Existing data: Data lake, etc
Existing Tools
The talk track presented to executives centered around building twice to use once, and needing to shift the paradigm to build once use many with the overlaps. Projects in-flight can be integrated.
- ProposalGen.pl: a PERL script created by Principal Architects which is able to generate a lightweight diagram based on CLI inputs (number of sites, service layers, members per site, etc)
- Support Auto Analysis Tool: the longterm home of PIANO, it is able to derive configuration and operation insights from existing deployments
- PIANO: an automation suite created by a tiger team of architects which generates reports from an existing customer deployment
- DNS Advisor / Infoblox Inspect: a pentesting-like tool which is able to asses and identify existing DNS deployments
- Data count scripts: Professional services tools which are able to pull DHCP scopes from various L3 devices, DNS data from various servers, etc
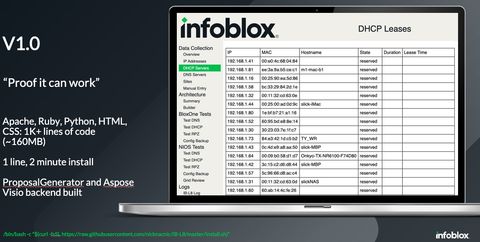
- IBL8: v0 of this project to prove it can work, sourcing DHCP data from Palo Alto Networks Firewalls to create Visio diagrams using Aspose.io python SDK. Built using an existing PAN tool used in the BlackHat NOC, PAN-AF.
Sales Motion

It is then seen as desirable to create guardrails for which, if a design meets the criteria, additional inspection is not required. If it already conforms to best practice, which can be described programmatically, then we may free up our most experienced resources to do higher-impact work.
Overview - Automation
The question that kept me up at night, and frequently plagued my deals -- what happens if a customer is unable or unwilling to complete the sizing sheet? Is it still possible to get a quote generated, why or why not? When presented to engineering, they disagreed a customer is more willing to download a container (IB-L8) versus run scripts and provide the data as an artifact.
Data Sources
The first major blind spot. Us automation-savvy folks assumed the teams we spoke with would be willing to wget, ftp, ssh, etc this file on GitHub onto their DC or RODC to complete the sizing portions. Some were not comfortable with this premise.
Collection Data
Thought of as "hard numbers" which aren't algorithmically-derived.
def dhcp_data: dhcp_server_count (int), dhcp_lps (int), dhcp_subnet_count (int), gen_vendor (str), dhcp_lease_time (int), dhcp_device_count (int)
def dns_data: dns_ext_ipv6_used (bool), dns_int_ipv6_used (bool), dns_int_caching_forwarders (str), dns_ext_forward_zone_count (int), dns_ext_reverse_zone_count (int), dns_int_forward_zone_count (int), dns_int_reverse_zone_count (int), dns_ext_server_count (int), dns_int_server_count (int), dns_ext_record_count (int), dns_int_record_count (int), dns_int_dnssec_used (bool), dns_ext_dnssec_used (bool), dns_int_vendor (str), gen_vendor (str), dns_int_qps (int), dns_ext_qps (int), dns_int_ad_domain_count (int)
def other_data: gen_site_count (int), gen_active_user (int), gen_active_ip (int)
Survey Data
"Soft inputs" which cannot be algorithmically determined.
Company Name, User Name, User Email, Number of Routers and Switches, BYOD Policy, Average Devices per User, Data Centers and DR Sites, DR Configuration, Policy for Core Services, Virtualization Platforms, Cloud Providers, Network Connectivity, Independent DNS/DHCP Sites, Network Growth Rate, IPv6 Implementation, Queries per Second, DNSSEC Implementation, IPv6 Implementation (5 years), Load Balancer Type, DNS Query Logging, Caching DNS Usage, Number of Caching Servers, Types of Caching DNS, DHCP Client Ratio, Network Discovery Tools, IPAM Discovery Tool, IPAM Management Tool, Engagement Type, Change Window, DNS Security Protection, Integration Interest, Large Site User Size, Number of Large Sites 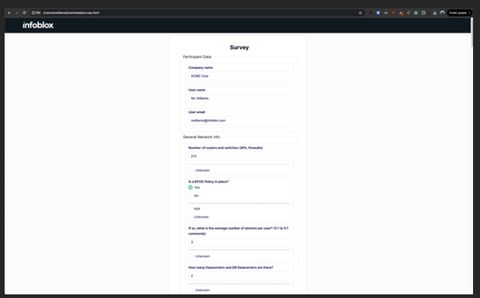
Analysis
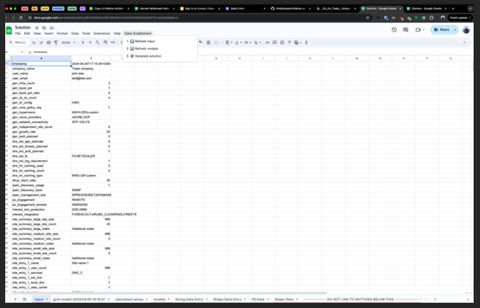
Once collected, the survey and data collection CSVs are placed into a customer folder in Salesforce, which then generated the corresponding Google Sheet, which possessed a custom "Sales Enablement" button which allowed for 3 functions: refresh input (for manually tweaking inputs), refresh models (inputs decided on DNS/DHCP model sizes) after inputs, and generate solution.
Design
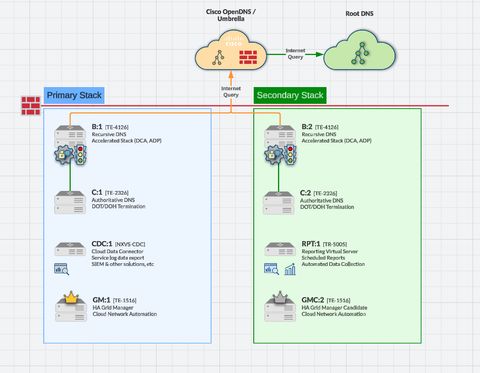
It is at this point we run into our second most-contested portion of this project. The principal architects fundamentally disagreed whether or not this is a deterministic problem space. For example, if we say 'best practice internal authoritative DNS' is 'HA pairs at core (C) sites, individual members at medium sites (M), backhaul for small sites (S), all in anycast controlled through an HA stealth primary' you'd have an equation potentially like 2C + 2 + M so for 3 core sites and 5 medium sites, 13 total DNS servers.
The disagreement stems from a best practice is a guide, not a principle, so there are likely organizations in which it won't make sense. For example, you probably need to be over a certain site count / size to warrant a stealth primary. At an even larger size, perhaps you have a stealth primary and multiple secondaries ready to take over in the event of a stealth primary outage. As the scope increased (cache DNS, DHCP, intelligent traffic steering, protective DNS) the variance of opinions grew, too.
Though the principals agreed it's likely most designs given the same data are 85% similar (there is a thought-based algorithm to a design), they did not agree it was possible to reduce that outcome to policies describable in programming. This is the kiss of death, from this point on there are diminishing returns from the project until it's demise.
Outputs
BOM
Most of the BOM generation is possible thanks to previously achieved work in ProposalGen.pl. So ensuring reporting, DDoS-mitigation, and other best practices from an inclusion perspective are adhered was easy enough.
Generally, from the data imported (total IP counts, DNS records, etc) it's possible to pick a management node size from the DB size specs, and based on sites / desired services per site.
Lucid/Visio
Being that Lucid support custom shapes, it's possible to then link the data of site names, layer names, and value add services within Google Sheets to pre-populate shapes from a template repository. Lucid excelled in their capabilities to deliver uniformity of shapes, however, creating a drawing through API-only (i.e. create the sites named primary stack and secondary stack with the correct server shape inside) isn't possible.
So essentially, you'd have pre-populated shapes you could copy-paste onto the right template pages, but as far as reducing the overhead of the 'actual' architecture work, the project stalled at getting the data operationalized into the workflow.
Appendix
Links
- Infoblox Open GitHub - ABLATE Scripts
- IBL8 private archive
Notes
As mentioned at the top, deciding the merit of an automation project based on optics... Customers didn't wish to run the scoping scripts on their servers. Employees didn't wish to make institutional knowledge programmatic, potentially threaten jobs. The target audience we presented to (professional services, world wide field operations) didn't possess many champions.
Although this project resulted in failure, I learned a lot. I'm looking forward to sharing the next few projects in which this type of automation resulted in amazing success.
We estimated this project saved ~17,000 hours across world wide field operations and engineering annually.
Spot a typo or want to suggest a change? Edit lands as a PR against the public mirror.