Graylog for Infoblox
Creating a reporting source for Infoblox with Graylog.
Now that my logging repository is up and running (previous post here), let's start with visibility into core services. I currently operate a hybrid deployment of SaaS-managed UDDI NIOS-X servers, and locally managed on-prem NIOS servers.
Enable Logging
UDDI, Threat Defense, etc.
First, this walkthrough assumes you've already deployed a NIOS-X VM for services, and this is a lightweight walkthrough for the data connector / log forwarder. A subsequent blog post will document that configuration, but a high level overview will be shown below.
Once a service is deployed to your host, you then configure which logs will flow to it. In this case, I've configured the IP address and port to flow into graylog as a destination, the source is the cloud, and I've applied an ETL as there are many users of this tenant.
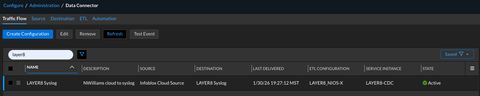
Within in the portal's source configuration, you are able to select which types of logs you'd like to flow to your data connector VM. The ETL/filters in this case are the name of the protocol-serving NIOS-X host.

NIOS
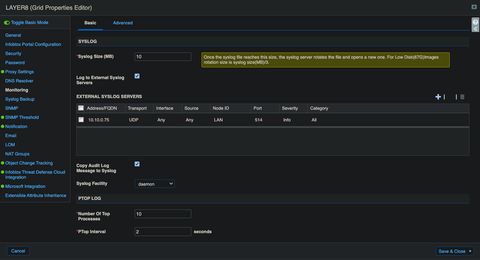
WARNING: Proceed with caution! Enabling syslog forwarding on NIOS servers incurs a cost to performance of DHCP leases per second and DNS queries per second.
This is a two-step configuration: enable syslog on the DNS service, enable forwarding to external servers on the grid. First:
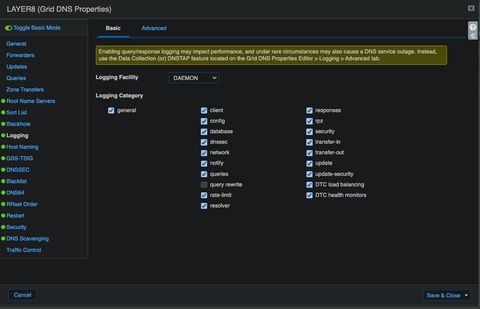
Once the service logging is enabled, you configured the grid to forward logs, pick a different port than UDDI:
Log Receiving
In the graylog console, head on over to system->inputs->launch new input and scroll to new UDP source. All the defaults are fine.
allow_override_date: true
bind_address: 0.0.0.0
charset_name: UTF-8
expand_structured_data: false
force_rdns: true
number_worker_threads: 4
override_source: <empty>
port: 514
recv_buffer_size: 262144
store_full_message: false
timezone: America/Denver
And do not forget to open the port on your graylog host!
sudo ufw allow 514/udpCreating Log Streams
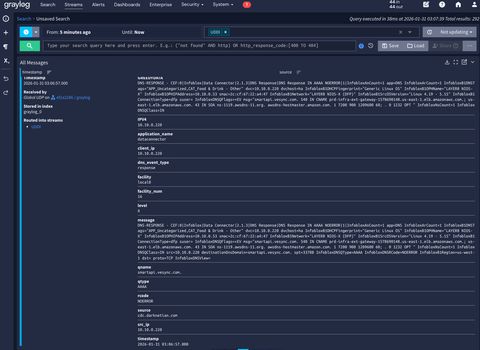
Logs will then flow into your default stream. Let's go ahead and split those out.
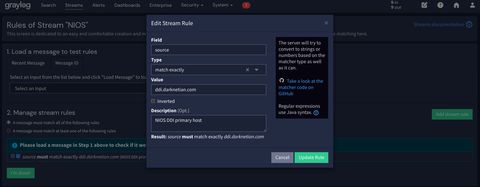
You'll want to do the same but create a CEF (or LEEF, depending on your data connector config) for the data connector VM. Since you use different ports as streams, you are able to split the logic by hostname or port. Since the NIOS grid uses many members for specific functions, I chose source (fqdn).
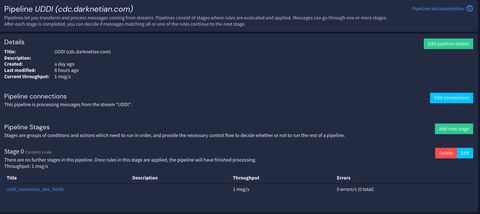
When both sources are flowing, now we need pipelines to modify the logs to our liking.
Creating Data Pipelines
Under system->pipelines, you'll want to add a new one. Ensure under the 'edit connections' button to the right of the screen you attach this pipeline to the appropriate stream you just created.
At this point, it's time to create your first rule. Click manage rules in the top left, then create rule in the top right, use source code editor, and confirm to open up the rule editing page.
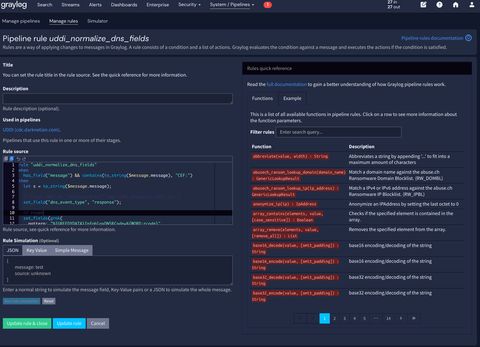
The rule source, or code, for this example is below.
rule "uddi_normalize_dns_fields"
when
  has_field("message") && contains(to_string($message.message), "CEF:")
then
  let s = to_string($message.message);

  // Treat UDDI as "response/event" logs (DNS Response, RPZ, etc.)
  set_field("dns_event_type", "response");

  // rcode
  set_fields(grok(
    pattern: "%{GREEDYDATA}InfobloxDNSRCode=%{WORD:rcode}",
    value: s
  ));

  // qname (destinationDnsDomain ends with a dot often; use NOTSPACE to stop at whitespace)
  set_fields(grok(
    pattern: "%{GREEDYDATA}destinationDnsDomain=%{NOTSPACE:qname}",
    value: s
  ));

  // qtype
  set_fields(grok(
    pattern: "%{GREEDYDATA}InfobloxDNSQType=%{WORD:qtype}",
    value: s
  ));

  // client_ip: use dvc (culprit), DO NOT overwrite with src
  set_fields(grok(
    pattern: "%{GREEDYDATA}dvc=%{IP:client_ip}",
    value: s
  ));

  // optional: capture src separately so you can debug/compare later
  set_fields(grok(
    pattern: "%{GREEDYDATA}src=%{IP:src_ip}",
    value: s
  ));
end
With the rules applied, we can head back to that stream and see the rules applied as new headers for a message.
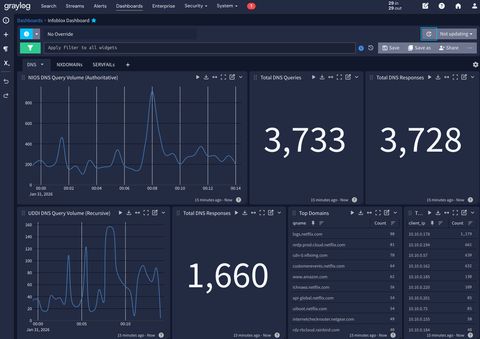
Dashboards
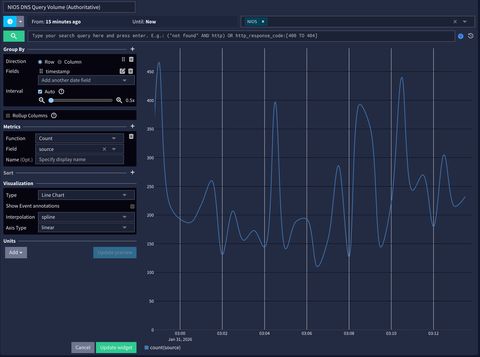
DNS
I created a few custom aggregations. In the next post we'll cover why the recursive query count is so high compared to total query count. 😎
Query Volume
You'll want to create an aggregation showing time on the X axis, a count of metrics (see at the top right my source is my NIOS stream) and I picked line chart / spline as the most pleasing to my eye.
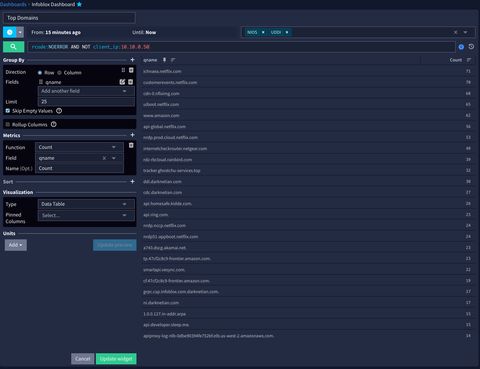
Top Domains
Since the data is normalized on qname (the pipeline values you previously configured) then you may create a widget which creates rows of qnames and groups them by their same counts.
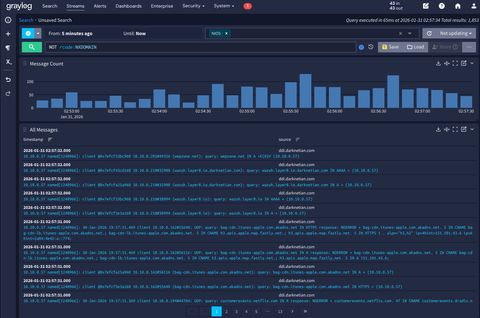
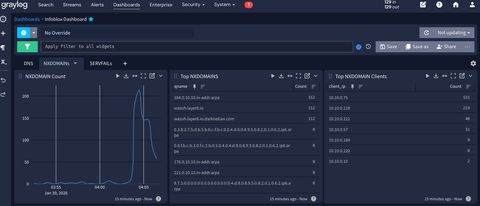
NXDOMAIN
In this case add in rcode:NXDOMAIN to the search query.
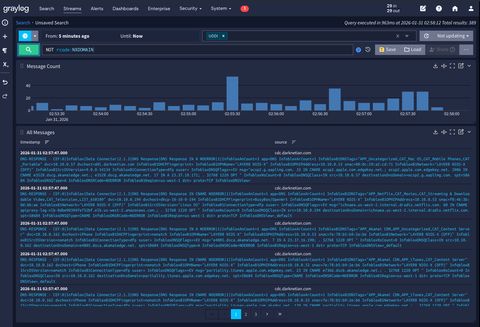
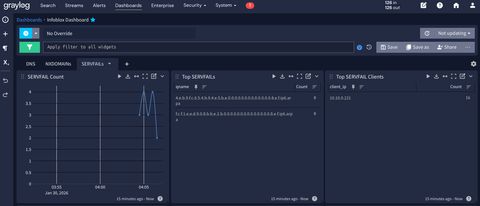
SERVFAIL
Same as above but rcode:SERVFAIL
Happy hunting! More dashboards to come and will be added over time to my graylog GitHub. You'll notice something extra fun in the dashboards that total queries =! responses. Is that due to indexing timers not aligning, or something more sinister? Advanced hunting to follow...
Spot a typo or want to suggest a change? Edit lands as a PR against the public mirror.