Adding Observability to the Homelab
Adding Grafana and Prometheus for SNMP data.
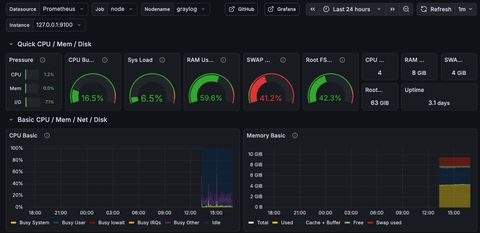
So, we've got a a running log source, but that doesn't cover an observability use case. Let's run through a minimal grafana + prometheus setup for the homelab, and create the snmp walking functionality to populate our dashboards.
I previously put Graylog on an Ubuntu host (here), and this setup will exist on the same host, which means there's an optional nginx configuration at the end.
Installation
Node Exporter
Create the dedicated user on your host, and download the latest Node Exporter and install the binary.
sudo useradd --system --no-create-home --shell /usr/sbin/nologin node_exporter

cd /tmp
NE_TAG="$(curl -fsSL https://api.github.com/repos/prometheus/node_exporter/releases/latest \
  | grep -Po '"tag_name":\s*"\Kv[0-9.]+' | head -n1)"
echo "Latest node_exporter tag: $NE_TAG"

NE_VER="${NE_TAG#v}"
wget -q "https://github.com/prometheus/node_exporter/releases/download/${NE_TAG}/node_exporter-${NE_VER}.linux-amd64.tar.gz"
tar -xzf "node_exporter-${NE_VER}.linux-amd64.tar.gz"
sudo install -m 0755 "node_exporter-${NE_VER}.linux-amd64/node_exporter" /usr/local/bin/node_exporter
Create the systemd service so it restarts upon reboot.
sudo tee /etc/systemd/system/node_exporter.service >/dev/null <<'EOF'
[Unit]
Description=Prometheus Node Exporter
Wants=network-online.target
After=network-online.target

[Service]
User=node_exporter
Group=node_exporter
Type=simple
ExecStart=/usr/local/bin/node_exporter

# basic hardening
NoNewPrivileges=true
ProtectSystem=strict
ProtectHome=true
PrivateTmp=true
ProtectKernelTunables=true
ProtectKernelModules=true
ProtectControlGroups=true

Restart=on-failure
RestartSec=2

[Install]
WantedBy=multi-user.target
EOF
Start and verify.
sudo systemctl daemon-reload
sudo systemctl enable --now node_exporter
sudo systemctl status node_exporter --no-pager -l

curl -s http://127.0.0.1:9100/metrics | head
Prometheus
Create users / directories.
sudo useradd --system --no-create-home --shell /usr/sbin/nologin prometheus
sudo mkdir -p /etc/prometheus /var/lib/prometheus
sudo chown -R prometheus:prometheus /etc/prometheus /var/lib/prometheus
sudo chmod 0755 /etc/prometheus /var/lib/prometheus
Download latest and install binaries.
cd /tmp

P_TAG="$(curl -fsSL https://api.github.com/repos/prometheus/prometheus/releases/latest \
  | grep -Po '"tag_name":\s*"\Kv[0-9.]+' | head -n1)"
echo "Latest prometheus tag: $P_TAG"

P_VER="${P_TAG#v}"
wget -q "https://github.com/prometheus/prometheus/releases/download/${P_TAG}/prometheus-${P_VER}.linux-amd64.tar.gz"

tar -xzf "prometheus-${P_VER}.linux-amd64.tar.gz"

sudo install -m 0755 "prometheus-${P_VER}.linux-amd64/prometheus" /usr/local/bin/prometheus
sudo install -m 0755 "prometheus-${P_VER}.linux-amd64/promtool" /usr/local/bin/promtool

# console templates (nice-to-have)
cp -a "prometheus-${P_VER}.linux-amd64/consoles" /etc/prometheus/
cp -a "prometheus-${P_VER}.linux-amd64/console_libraries" /etc/prometheus/

sudo chown -R prometheus:prometheus /etc/prometheus
Create and install a minimal config to scrape itself and node exporter.
sudo tee /etc/prometheus/prometheus.yml >/dev/null <<'YAML'
global:
  scrape_interval: 15s
  evaluation_interval: 15s

scrape_configs:
  - job_name: prometheus
    static_configs:
      - targets: ['127.0.0.1:9090']

  - job_name: node
    static_configs:
      - targets: ['127.0.0.1:9100']
YAML

chown prometheus:prometheus /etc/prometheus/prometheus.yml
promtool check config /etc/prometheus/prometheus.yml
Create and start the systemd service.
sudo tee /etc/systemd/system/prometheus.service >/dev/null <<'EOF'
[Unit]
Description=Prometheus
Wants=network-online.target
After=network-online.target

[Service]
User=prometheus
Group=prometheus
Type=simple
ExecStart=/usr/local/bin/prometheus \
  --config.file=/etc/prometheus/prometheus.yml \
  --storage.tsdb.path=/var/lib/prometheus \
  --web.listen-address=127.0.0.1:9090 \
  --web.console.templates=/etc/prometheus/consoles \
  --web.console.libraries=/etc/prometheus/console_libraries

# basic hardening
NoNewPrivileges=true
ProtectSystem=strict
ProtectHome=true
PrivateTmp=true
ReadWritePaths=/var/lib/prometheus /etc/prometheus

Restart=on-failure
RestartSec=2

[Install]
WantedBy=multi-user.target
EOF

sudo systemctl daemon-reload
sudo systemctl enable --now prometheus
sudo systemctl status prometheus --no-pager -l
curl -s http://127.0.0.1:9090/-/ready && echo # optional validation
curl -s http://127.0.0.1:9090/api/v1/targets | grep -E '"job"|"health"' | head -n 40 # optional validation
Grafana
The UI management component of our observability tool. Let's add the repo, install, and start.
sudo apt-get update
sudo apt-get install -y apt-transport-https software-properties-common wget

sudo mkdir -p /etc/apt/keyrings
sudo wget -qO- https://apt.grafana.com/gpg.key | gpg --dearmor -o /etc/apt/keyrings/grafana.gpg

sudo echo "deb [signed-by=/etc/apt/keyrings/grafana.gpg] https://apt.grafana.com stable main" \
  > /etc/apt/sources.list.d/grafana.list

sudo apt-get update
sudo apt-get install -y grafana
sudo systemctl daemon-reload
sudo systemctl enable --now grafana-server
sudo systemctl status grafana-server --no-pager -l
ss -lntp | grep -E ':3000\b' # optional validation
curl -I http://127.0.0.1:3000 | head -n 5 # optional validation
I needed to force Grafana to IPv4 localhost, for some reason it defaulted to IPv6.
sudo perl -0777 -i -pe 's/^[; ]*http_addr\s*=.*$/http_addr = 127.0.0.1/m' /etc/grafana/grafana.ini
sudo perl -0777 -i -pe 's/^[; ]*http_port\s*=.*$/http_port = 3000/m' /etc/grafana/grafana.ini

sudo systemctl restart grafana-server
It's time to link the two together.
sudo install -d -m 0755 /etc/grafana/provisioning/datasources
sudo tee /etc/grafana/provisioning/datasources/prometheus.yaml >/dev/null <<'YAML'
apiVersion: 1
datasources:
- name: Prometheus
type: prometheus
access: proxy
url: http://127.0.0.1:9090
isDefault: true
editable: true
YAML
sudo chown -R root:grafana /etc/grafana/provisioning/datasources
sudo chmod 0640 /etc/grafana/provisioning/datasources/prometheus.yaml
sudo systemctl restart grafana-server
curl -s http://127.0.0.1:9090/-/ready && echo # optional validation
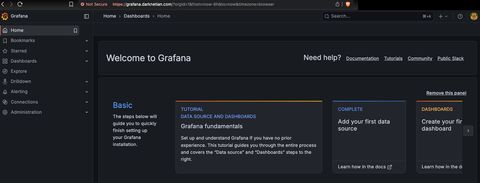
curl -I http://127.0.0.1:3000/login | head -n 5 # optional validationAt this point you should be greeted by a login page.
SNMP Exporter
This is the tool that we will use to import MIBs to crawl homelab devices to generate dashboards from.
sudo apt-get update
sudo apt-get install -y prometheus-snmp-exporter
Start and verify it's listening.
sudo systemctl enable --now prometheus-snmp-exporter
sudo systemctl status prometheus-snmp-exporter --no-pager -l

ss -lntp | grep -E ':9116\b' || true
curl -s http://127.0.0.1:9116/metrics | head
At this point, I'd like to create a directory of where to store discovered device information, and then auto-scrape my LAN.
sudo install -d -m 0755 /etc/prometheus/targetsUpdate /etc/prometheus/prometheus.yml to include a new dynamic job.
sudo perl -0777 -i -pe 's/\n\s*- job_name: snmp\b.*?(?=\n\s*- job_name:|\z)//s' /etc/prometheus/prometheus.yml
COMMUNITY="layer8lab"

sudo tee -a /etc/prometheus/prometheus.yml >/dev/null <<YAML

  - job_name: snmp
    metrics_path: /snmp
    params:
      module: [if_mib]
      community: ["${COMMUNITY}"]
    file_sd_configs:
      - files:
          - /etc/prometheus/targets/snmp.json
        refresh_interval: 60s
    relabel_configs:
      - source_labels: [__address__]
        target_label: __param_target
      - source_labels: [__param_target]
        target_label: instance
      - target_label: __address__
        replacement: 127.0.0.1:9116
YAML

sudo promtool check config /etc/prometheus/prometheus.yml
sudo systemctl reload prometheus
# Create initial targets
sudo tee /etc/prometheus/targets/snmp.json >/dev/null <<'JSON'
[
  { "targets": [], "labels": { "job": "snmp" } }
]
JSON
So your final prometheus.yml config should resemble:
global:
  scrape_interval: 15s
  evaluation_interval: 15s

scrape_configs:
  - job_name: prometheus
    static_configs:
      - targets: ['127.0.0.1:9090']

  - job_name: node
    static_configs:
      - targets: ['127.0.0.1:9100']

  - job_name: snmp
    metrics_path: /snmp
    params:
      module: [if_mib]
      community: ["layer8lab"]
    file_sd_configs:
      - files:
          - /etc/prometheus/targets/snmp.json
        refresh_interval: 60s
    relabel_configs:
      - source_labels: [__address__]
        target_label: __param_target
      - source_labels: [__param_target]
        target_label: instance
      - target_label: __address__
        replacement: 127.0.0.1:9116
Discovery Scripting
Let's add in the recurring runs to iterate through the /24 LAN.
sudo apt-get update
sudo apt-get install -y fping snmp

sudo tee /usr/local/bin/discover-snmp-targets >/dev/null <<'BASH'
#!/usr/bin/env bash
set -euo pipefail

SUBNET="${SUBNET:-10.10.0.0/24}"
COMMUNITY="${COMMUNITY:-layer8lab}"
OUT="${OUT:-/etc/prometheus/targets/snmp.json}"
TMP="${OUT}.tmp"

# 1) Fast ping sweep (only live hosts)
LIVE_IPS="$(
  fping -a -q -g "$SUBNET" 2>/dev/null || true
)"

# 2) SNMP probe each live host (sysUpTime.0 is cheap + universal)
GOOD=()
for ip in $LIVE_IPS; do
  if timeout 1 snmpget -v2c -c "$COMMUNITY" -Ovq "$ip" 1.3.6.1.2.1.1.3.0 >/dev/null 2>&1; then
    GOOD+=("$ip")
  fi
done

# 3) Emit Prometheus file_sd JSON (atomic write)
{
  echo "["
  echo '  { "targets": ['
  for i in "${!GOOD[@]}"; do
    ip="${GOOD[$i]}"
    if [[ "$i" -lt $((${#GOOD[@]}-1)) ]]; then
      echo "    \"${ip}:161\","
    else
      echo "    \"${ip}:161\""
    fi
  done
  echo '  ], "labels": { "job": "snmp", "module": "if_mib" } }'
  echo "]"
} > "$TMP"

mv -f "$TMP" "$OUT"
BASH

sudo chmod 0755 /usr/local/bin/discover-snmp-targets
# Run it for testing once
/usr/local/bin/discover-snmp-targets
wc -c /etc/prometheus/targets/snmp.json
head -n 40 /etc/prometheus/targets/snmp.json
Your output hopefully looks like:
[ { "targets": [ "10.10.0.30:161", "10.10.0.50:161", "10.10.0.54:161", "10.10.0.55:161", "10.10.0.56:161", "10.10.0.57:161", "10.10.0.201:161", "10.10.0.210:161", "10.10.0.222:161" ], "labels": { "job": "snmp", "module": "if_mib" } } ]Create the systemd service schedule.
sudo tee /etc/systemd/system/discover-snmp-targets.service >/dev/null <<'EOF'
[Unit]
Description=Discover SNMP targets for Prometheus file_sd

[Service]
Type=oneshot
Environment=SUBNET=10.10.0.0/24
Environment=COMMUNITY=layer8lab
Environment=OUT=/etc/prometheus/targets/snmp.json
ExecStart=/usr/local/bin/discover-snmp-targets
EOF

sudo tee /etc/systemd/system/discover-snmp-targets.timer >/dev/null <<'EOF'
[Unit]
Description=Run SNMP target discovery every 5 minutes

[Timer]
OnBootSec=1min
OnUnitActiveSec=5min
AccuracySec=30s
Persistent=true

[Install]
WantedBy=timers.target
EOF

sudo systemctl daemon-reload
sudo systemctl enable --now discover-snmp-targets.timer
sudo systemctl list-timers --all | grep discover-snmp-targets || true
At this point, it's time to create a module to pull the MIBs added into /etc/prometheus/snmp.yml.
modules:
  kitchen_sink_v2c:
    walk:
      # System
      - 1.3.6.1.2.1.1

      # Interfaces (ifTable + ifXTable)
      - 1.3.6.1.2.1.2
      - 1.3.6.1.2.1.31.1.1

      # IP / ICMP / TCP / UDP
      - 1.3.6.1.2.1.4
      - 1.3.6.1.2.1.5
      - 1.3.6.1.2.1.6
      - 1.3.6.1.2.1.7

      # Host resources (CPU/mem/disk *if* supported)
      - 1.3.6.1.2.1.25

      # UCD-SNMP (many Linux/Unix agents expose extra goodies)
      - 1.3.6.1.4.1.2021

      # ENTITY-MIB (hardware inventory on many network devices)
      - 1.3.6.1.2.1.47

      # Vendor enterprise tree (THIS is the “everything” knob)
      # WARNING: can be huge depending on device
      - 1.3.6.1.4.1
NGINX
Create the host configuration.
tee /etc/nginx/sites-available/grafana.conf >/dev/null <<'CONF'
server {
  listen 80;
  server_name grafana.darknetian.com;
  return 301 https://$host$request_uri;
}

server {
  listen 443 ssl http2;
  server_name grafana.darknetian.com;

  ssl_certificate     /etc/nginx/ssl/grafana.crt;
  ssl_certificate_key /etc/nginx/ssl/grafana.key;

  location / {
    proxy_pass http://127.0.0.1:3000;

    proxy_set_header Host              $http_host;
    proxy_set_header X-Real-IP         $remote_addr;
    proxy_set_header X-Forwarded-For   $proxy_add_x_forwarded_for;
    proxy_set_header X-Forwarded-Proto $scheme;

    # websockets (Grafana uses these)
    proxy_http_version 1.1;
    proxy_set_header Upgrade $http_upgrade;
    proxy_set_header Connection "upgrade";
  }
}
CONF
Create the local signed cert.
mkdir -p /etc/nginx/ssl
openssl req -x509 -nodes -newkey rsa:4096 -days 825 \
  -keyout /etc/nginx/ssl/grafana.key \
  -out /etc/nginx/ssl/grafana.crt \
  -subj "/CN=grafana.darknetian.com" \
  -addext "subjectAltName=DNS:grafana.darknetian.com"
Enable the site.
sudo ln -sf /etc/nginx/sites-available/grafana.conf /etc/nginx/sites-enabled/grafana.conf
sudo nginx -t && sudo systemctl reload nginx
Update grafana redirects.
sudo perl -0777 -i -pe 's~^[; ]*root_url\s*=.*$~root_url = https://grafana.darknetian.com/~m' /etc/grafana/grafana.ini
sudo systemctl restart grafana-server
Configuration
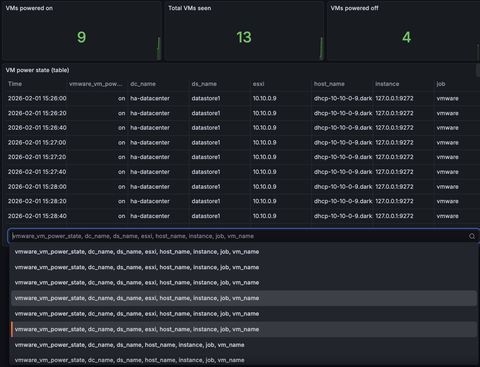
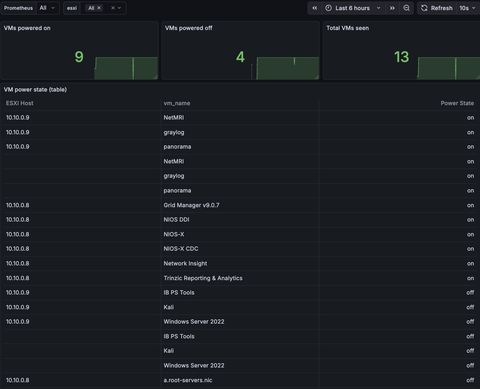
Now that we know SNMP running against our hosts, it's time to create dashboards of what we want to see.
For specifically the VM dashboard you need to update the prometheus yaml to include some of the new modules.
sudo tee /etc/prometheus/prometheus.yml >/dev/null <<'YAML'
global:
  scrape_interval: 15s
  evaluation_interval: 15s

scrape_configs:
  - job_name: prometheus
    static_configs:
      - targets: ['127.0.0.1:9090']

  - job_name: node
    static_configs:
      - targets: ['127.0.0.1:9100']

  - job_name: snmp
    metrics_path: /snmp
    params:
      module: [if_mib]
      auth: [public_v2]
    file_sd_configs:
      - files:
          - /etc/prometheus/targets/snmp.json
        refresh_interval: 60s
    relabel_configs:
      - source_labels: [__address__]
        regex: '([^:]+)(?::\d+)?'
        target_label: __tmp_target
        replacement: '$1'
      - source_labels: [__tmp_target]
        target_label: __param_target
      - source_labels: [__param_target]
        target_label: instance
      - target_label: __address__
        replacement: 127.0.0.1:9116

  - job_name: vmware
    static_configs:
      - targets: ['127.0.0.1:9272']
YAML

sudo promtool check config /etc/prometheus/prometheus.yml && systemctl restart prometheus
sudo curl -s http://127.0.0.1:9090/api/v1/targets | grep -E '"job":"vmware"|"health"|"lastError"' -n
The starting point for the dashboard I imported goes like this:
{
  "annotations": {
    "list": [
      {
        "builtIn": 1,
        "datasource": "-- Grafana --",
        "enable": true,
        "hide": true,
        "iconColor": "rgba(0, 211, 255, 1)",
        "name": "Annotations & Alerts",
        "type": "dashboard"
      }
    ]
  },
  "editable": true,
  "fiscalYearStartMonth": 0,
  "graphTooltip": 1,
  "id": null,
  "links": [],
  "liveNow": false,
  "panels": [
    {
      "datasource": {
        "type": "prometheus",
        "uid": "${DS_PROMETHEUS}"
      },
      "fieldConfig": {
        "defaults": {
          "unit": "short"
        },
        "overrides": []
      },
      "gridPos": {
        "h": 4,
        "w": 8,
        "x": 0,
        "y": 0
      },
      "id": 1,
      "options": {
        "reduceOptions": {
          "calcs": [
            "lastNotNull"
          ],
          "fields": "",
          "values": false
        },
        "orientation": "horizontal",
        "textMode": "auto",
        "colorMode": "value"
      },
      "pluginVersion": "10.0.0",
      "targets": [
        {
          "editorMode": "code",
          "expr": "sum(vmware_vm_power_state{host_name=~\"$esxi\"})",
          "legendFormat": "powered on",
          "range": true,
          "refId": "A"
        }
      ],
      "title": "VMs powered on",
      "type": "stat"
    },
    {
      "datasource": {
        "type": "prometheus",
        "uid": "${DS_PROMETHEUS}"
      },
      "fieldConfig": {
        "defaults": {
          "unit": "short"
        },
        "overrides": []
      },
      "gridPos": {
        "h": 4,
        "w": 8,
        "x": 8,
        "y": 0
      },
      "id": 2,
      "options": {
        "reduceOptions": {
          "calcs": [
            "lastNotNull"
          ],
          "fields": "",
          "values": false
        },
        "orientation": "horizontal",
        "textMode": "auto",
        "colorMode": "value"
      },
      "pluginVersion": "10.0.0",
      "targets": [
        {
          "editorMode": "code",
          "expr": "count(vmware_vm_power_state{host_name=~\"$esxi\"})",
          "legendFormat": "total",
          "range": true,
          "refId": "A"
        }
      ],
      "title": "Total VMs seen",
      "type": "stat"
    },
    {
      "datasource": {
        "type": "prometheus",
        "uid": "${DS_PROMETHEUS}"
      },
      "fieldConfig": {
        "defaults": {
          "unit": "short"
        },
        "overrides": []
      },
      "gridPos": {
        "h": 4,
        "w": 8,
        "x": 16,
        "y": 0
      },
      "id": 3,
      "options": {
        "reduceOptions": {
          "calcs": [
            "lastNotNull"
          ],
          "fields": "",
          "values": false
        },
        "orientation": "horizontal",
        "textMode": "auto",
        "colorMode": "value"
      },
      "pluginVersion": "10.0.0",
      "targets": [
        {
          "editorMode": "code",
          "expr": "count(vmware_vm_power_state{host_name=~\"$esxi\"}) - sum(vmware_vm_power_state{host_name=~\"$esxi\"})",
          "legendFormat": "powered off",
          "range": true,
          "refId": "A"
        }
      ],
      "title": "VMs powered off",
      "type": "stat"
    },
    {
      "datasource": {
        "type": "prometheus",
        "uid": "${DS_PROMETHEUS}"
      },
      "fieldConfig": {
        "defaults": {
          "custom": {
            "align": "auto",
            "displayMode": "auto",
            "inspect": false
          },
          "mappings": [
            {
              "options": {
                "0": {
                  "text": "off"
                },
                "1": {
                  "text": "on"
                }
              },
              "type": "value"
            }
          ]
        },
        "overrides": []
      },
      "gridPos": {
        "h": 12,
        "w": 24,
        "x": 0,
        "y": 4
      },
      "id": 4,
      "options": {
        "showHeader": true
      },
      "pluginVersion": "10.0.0",
      "targets": [
        {
          "editorMode": "code",
          "expr": "vmware_vm_power_state{host_name=~\"$esxi\"}",
          "legendFormat": "",
          "range": true,
          "refId": "A"
        }
      ],
      "title": "VM power state (table)",
      "transformations": [
        {
          "id": "labelsToFields",
          "options": {
            "mode": "columns"
          }
        },
        {
          "id": "organize",
          "options": {
            "excludeByName": {
              "__name__": true,
              "Time": false
            },
            "indexByName": {},
            "renameByName": {
              "Value": "power_state"
            }
          }
        }
      ],
      "type": "table"
    }
  ],
  "refresh": "10s",
  "schemaVersion": 39,
  "style": "dark",
  "tags": [
    "vmware",
    "esxi"
  ],
  "templating": {
    "list": [
      {
        "current": {},
        "hide": 0,
        "includeAll": true,
        "label": "Prometheus",
        "multi": false,
        "name": "DS_PROMETHEUS",
        "options": [],
        "query": "prometheus",
        "refresh": 1,
        "type": "datasource"
      },
      {
        "current": {},
        "datasource": {
          "type": "prometheus",
          "uid": "${DS_PROMETHEUS}"
        },
        "definition": "label_values(vmware_vm_power_state, host_name)",
        "hide": 0,
        "includeAll": true,
        "multi": true,
        "name": "esxi",
        "options": [],
        "query": {
          "query": "label_values(vmware_vm_power_state, host_name)",
          "refId": "PrometheusVariableQueryEditor-VariableQuery"
        },
        "refresh": 1,
        "type": "query"
      }
    ]
  },
  "time": {
    "from": "now-6h",
    "to": "now"
  },
  "timepicker": {},
  "timezone": "",
  "title": "ESXi (vmware_exporter) - Basics",
  "uid": null,
  "version": 1,
  "weekStart": ""
}
I also cheated a little bit and pulled a podman vmware_exporter to API call to talk to the VM hosts.
docker run --rm -p 9272:9272 \
  -e VSPHERE_HOST=10.10.0.9 \
  -e VSPHERE_USER=root \
  -e VSPHERE_PASSWORD='password' \
  -e VSPHERE_IGNORE_SSL=true \
  pryorda/vmware_exporter
With any luck, the default widget starts out showing all the podman jobs against every VM at once.
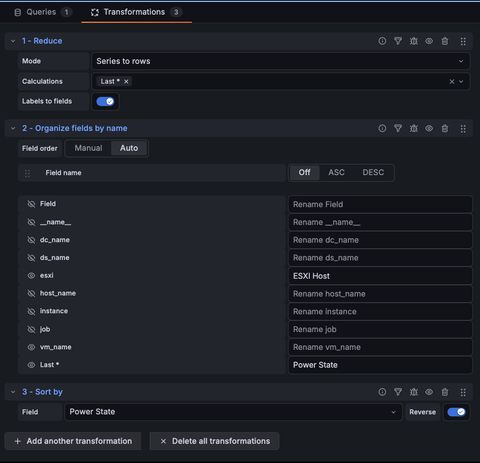
From here you just update the query: last_over_time(vmware_vm_power_state{job="vmware"}[6h]) and change the transformations:
- reduce series to rows calculating on Last * with labels to fields enabled
- organize fields by name
- sort by power state
With any luck, you'll now be able to add capabilities over time. This blog started as a way to understand data sources within observability tools, and from here, combining observability and telemetry I will walk through a former customer issue and how these datasources ultimately made the determining root cause analysis possible.
Spot a typo or want to suggest a change? Edit lands as a PR against the public mirror.