Over-Engineering Homelab Syslog Receiving With DNSTAP
Changing per-query DNS telemetry from syslog forwarding to a DNSTAP pipeline, and what the syslog path actually does on the appliance.
The previous Graylog enrichment posts wired the homelab's NIOS grid into Graylog over plain syslog forwarding (PTR/DHCP enrichment, dashboards, etc). It worked for everything except the one thing I wanted most: a sustained per-query stream off the recursive members for trending, dashboarding, and ad-hoc audit. Or rather, it worked fine, but I wanted to do what my big customers did as a learning exercise. The moment I turned on the BIND queries category, the members started complaining and the dashboards started lying. So I pulled query logging off syslog entirely and rebuilt the per-query path over DNSTAP. This post is the why, the what was wrong, and the pipeline the rebuild ended up at.
What NIOS Syslog Query Logging Actually Does
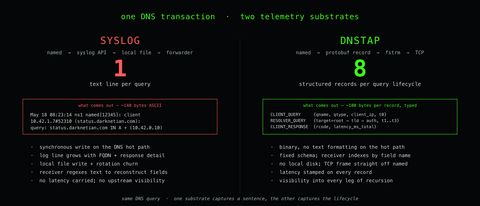
When you enable the DNS queries (or responses) logging category on a NIOS member, named emits one text syslog event per DNS transaction. The line looks roughly like this:
May 18 08:23:14 ns1 named[12345]: client 10.42.1.7#52310 (status.darknetian.com): query: status.darknetian.com IN A + (10.42.0.10)The fields are the BIND query-log defaults, documented in the BIND 9 Administrator Reference Manual: timestamp, hostname, named's PID, the client tuple, the queried FQDN, class, type, recursion flags, and the receiver address. That text line goes through the appliance's syslog pipeline (local syslog storage on the appliance plus optional forwarding to a remote syslog server). Local rotation is automatic; forwarder hand-off is whatever syslog daemon the appliance ships with.
Two properties of that path matter for what comes next.
First, the log line is text. Every transaction produces a formatted string... the FQDN is rendered, the client IP is rendered, every flag is rendered. The size of the resulting log entry grows with the size of the data being printed. A query for a.b.c.d.e.f.g.h.really-long-internal-name.darknetian.com produces a longer log line than a query for nic.darknetian.com. For response logging the line grows further as response fields get rendered into the text format. The log entry is not a byte-for-byte copy of the DNS packet, but the volume of text scales with the amount of DNS data being printed.
Second, the path is named → syslog → local file → forwarder. Even when remote syslog forwarding is configured, the message lands on local disk first. On a busy member at sustained QPS, that's a synchronous hot path between the DNS service and the file system. The file system has to keep up with text formatting plus rotation churn, and on the BIND side, the ISC ARM is explicit that the default logging path is synchronous and "may significantly impact performance" at scale. ISC's own Knowledge Base calls query logging out as a feature that should be enabled for troubleshooting windows, not for continuous capture. The substrate isn't broken; it's just being asked to do a job it wasn't designed for.
Why the Impact Is Structural, Not Incidental
The textbook way to explain why a per-query text-logging path hurts is to walk what each transaction has to do, compared to what the DNS service alone would do.
A pure recursive query, no logging:
receive UDP/53 → parse question → walk cache → if miss, recurse → assemble answer → send UDP/53A pure recursive query with queries enabled:
receive UDP/53 → parse question → walk cache → if miss, recurse → assemble answer → send UDP/53
                                                                                     │
                                                                                     ▼
                                                                            format text log line
                                                                                     ▼
                                                                            syslog API call (write)
                                                                                     ▼
                                                                            local file write
                                                                                     ▼
                                                                            forwarder reads file
                                                                                     ▼
                                                                            TCP/UDP to remote syslog
Every box on that lower branch costs something. Time to put napkin numbers on it.
Napkin Math
The homelab grid runs two vNIOS recursive appliance VMs on a pair of HPE ProLiant DL380p Gen8 hosts. The relevant box hosts its datastore on a Smart Array P420i controller fronting eight 2.5" SAS HDDs comprised of six 1.2 TB at 10.5K rpm in the data pool plus two 300 GB at 10K rpm for boot. All rotational, no SSDs in this chassis. NIOS itself logs through a rsyslog-compatible syslog daemon to a local file before any forwarding. Plug in actual rates from a normal day on the recursive members:
| Quantity | Symbol | Homelab value |
|---|---|---|
| Sustained recursive QPS (24h avg) | $Q$ | ~13 qps |
| Recent-minute peak | $Q_{\text{peak}}$ | ~16 qps |
| Mean syslog text line | $L_{\text{syslog}}$ | ~180–250 bytes (typical FQDN; +50–100 bytes for response logging) |
| Per-query syslog work | $I$ | one write(2) to the syslog socket → rsyslog formats + writes to local file → forwarder reads file and ships TCP |
| DNS hot-path budget on a quiet recursive | $T$ | a cache hit answers in well under 1 ms; anything that adds to that is a measurable percentage |
The first thing to call out is that this is a small homelab grid 13 qps sustained is nothing. The Smart Array P420i carries an FBWC (flash-backed write cache); at 13 qps the per-query syslog write is absorbed entirely into the cache and flushed to platters in coalesced batches. At this load, disk IOPS is not the bottleneck.
What is a measurable cost at this load is the per-query hot-path work that runs before the data ever hits the controller cache:
vsnprintf-style assembly of the log line: cheap per call, but the format includes the FQDN, which is heap allocation territory unless BIND inlines short strings.- A
write(2)to the syslog socket: typically blocks until the syslog daemon has accepted the message into its in-memory queue. - The syslog daemon's own
write(2)to the local file: notO_SYNCby default, but still subject to filesystem journaling and the kernel's writeback policy. - Whatever the forwarder does to ship the line to Graylog over TCP — page-cache reads, formatting per RFC 5424, TCP send.
Even at 13 qps that's a consistent extra tens of microseconds on every transaction, and that's the time named is not spending draining its UDP recv queue. On a quiet recursive server most queries answer from cache in well under a millisecond. A consistent extra 50–100 µs per query is a measurable percentage of the cache-hit budget, and it shows up directly as a CPU% delta on the member.
The IOPS-budget conversation becomes the dominant one when you scale the same architecture up. The aggregated random-write IOPS budget of a 6-disk RAID-5 pool varies wildly with what's in the chassis. For reference, against my Gen8's 10.5K SAS spindles:
| Drive class | Era | Typical random-write IOPS (QD1, 4K) | Aggregate (6-disk RAID-5) |
|---|---|---|---|
| 7.2K SATA HDD | any | ~150 | ~600 |
| 10K SAS HDD (mine — HPE EG1200JEMDA) | ~2013 | ~200 | ~800 |
| 15K SAS HDD | ~2014 | ~250 | ~1,000 |
| Mainstream SATA SSD (Crucial MX500, etc.) | ~2018 | ~30,000 | ~150,000 |
| Enterprise SAS SSD (HPE EH000800JWHPK) | ~2019 | ~80,000 | ~400,000 |
| Mainstream NVMe (Samsung PM9A3, WD SN740) | ~2022 | ~200,000 | n/a (no RAID write penalty in the same shape) |
Plug that table into a few representative QPS regimes:
| Regime | $Q$ | On my Gen8 SAS (~800 RAID IOPS) | On a modern SAS-SSD pool (~400K) | On NVMe |
|---|---|---|---|---|
| Homelab (this grid) | ~13 qps | FBWC absorbs everything; rounding error | n/a | n/a |
| Small production recursive | ~1,000 qps | spindles contend with config replication + reporting DB + rotation churn; FBWC papers over spikes but the rotational write floor is real | ~0.25% of budget; effortless | rounding error |
| Busy production recursive | ~10,000 qps | architecture falls over; even with 1 GB FBWC, sustained writes outpace the controller's flush rate | ~2.5% of budget; comfortable | rounding error |
| Anycast root-style | ~100,000 qps | not viable at any RAID width on rotational | ~25% of budget; starts to compete with everything else on the box | rounding error |
The headline isn't a fixed percentage. The headline is: per-query synchronous text-write telemetry costs a non-trivial fraction of every query's latency budget, and that fraction is unbounded above as logging gets verbose or disks get slower. Even at 13 qps the Gen8 architecture is doing more work per query than it needs to; the same architecture at 10,000 qps is doing impossible work per query. A modern SSD/NVMe fleet pushes the breaking point out one or two orders of magnitude, but the substrate is still wrong... eventually you migrate anyway. That's what makes it structural rather than incidental.
The Other Constraint: Linux Socket and FD Limits
The CPU/I/O budget is the obvious cost. There's a second, less-discussed family of limits Linux imposes on a busy DNS daemon that show up at high QPS regardless of which telemetry path you pick.
"The 4096 socket limit" is a common prompt that gets used to disambiguate these, because there are several different defaults around that number that get conflated.
| Limit | Where set | Default | What it caps |
|---|---|---|---|
net.core.somaxconn |
sysctl | 4096 (Linux 5.4+; was 128) | TCP listen backlog — pending accepts on a listening socket |
RLIMIT_NOFILE (hard) |
per-process via PAM/systemd | 4096 (classic), 524288 (systemd default) | Open file descriptors per process |
select() FD_SETSIZE |
glibc compile-time | 1024 | Max fds passable to select() (irrelevant to modern BIND — uses epoll) |
tcp_max_syn_backlog |
sysctl | scales with RAM (typ. 4096–8192) | Half-open SYN queue |
recursive-clients |
named.conf | 1000 | Concurrent recursing clients held by BIND itself |
For the syslog-vs-DNSTAP question specifically, none of these is the proximate cause of either path's pain. The things that actually bite a busy recursive on Linux are usually one of:
net.core.rmem_maxand the per-socket UDP recv buffer. When named can't drain UDP/53 fast enough, the kernel drops queries before BIND ever sees them. That loss is invisible to syslog query logging (the query never reaches the log step) but visible asRcvbufErrorsinnstat -zand asdropsinss -uan. Raisingrmem_maxand the per-socketSO_RCVBUFis the standard mitigation. Heavy text logging on the hot path makes named slower to drain the recv ring, so the syslog path can indirectly amplify this.RLIMIT_NOFILEonnamedwhen outbound recursion fan-out is high (one outgoing UDP socket per upstream query if it can't be coalesced). Modern systemd'sLimitNOFILE=524288covers it; the classic 1024/4096 from a non-systemd setup would not.recursive-clients(1000) before any kernel limit. At sustained 200 qps with ~50 ms median recursion latency, in-flight count is ~10. Far below the cap. At 5000 qps with slow upstreams, the math gets uncomfortable fast.
DNSTAP doesn't fix any of those, they're DNS-service-side, not telemetry-side. What DNSTAP does do is stop adding text-formatting + disk I/O to the per-query latency budget, which buys back a few percent of the time named spends not draining its UDP queue. On the receiver side, the dnscollector listener opens exactly one TCP socket per grid member; the FD and socket pressure on the appliance is negligible compared to what syslog forwarding contributes (one log file open, one TCP socket per remote syslog target, plus rsyslog's own internal queues).
DNSTAP and What Changes When the Substrate Changes
DNSTAP was designed by Robert Edmonds for exactly this gap. The idea: instead of a text log, emit a binary record per DNS transaction, framed by a streaming protocol designed to handle that record rate without choking. Concretely:
- Each event is a protobuf message: schema'd, compact, no text formatting required. The schema includes the query type and class, both source and destination IP/port, the wire-format DNS message itself, identity and version fields for the emitting daemon, and timing.
- The transport is Frame Streams (
fstrm): a framing protocol that carries the protobuf records over a reliable byte stream (typically TCP) with four bytes of framing overhead per data frame plus a separate control channel. - The capture point is inside the DNS daemon, the same way query logging is, but emitting the structured record instead of formatting and writing a text line. BIND added DNSTAP support in 9.11; it's been a first-class option ever since.
That last point is the one that matters. DNSTAP is not a packet capture sidecar; the DNS daemon itself is the producer, and what gets emitted is a transaction-level record (ie query, response, latency, identity) not a captured packet. Replacing a text log line with a ~100-byte protobuf payload eliminates the formatting step and almost all of the I/O along with it: no local file, no rotation, no forwarder reading the file back. The DNS daemon writes the binary frame to a TCP socket; the receiver does everything downstream.
What the Two Look Like Side by Side
The same DNS transaction emitted both ways:
Syslog query log (BIND default format, one line):
May 18 08:23:14 ns1 named[12345]: client 10.42.1.7#52310 (status.darknetian.com): query: status.darknetian.com IN A + (10.42.0.10)~140 ASCII bytes. To get fields out of this you regex it on the receiver. The latency is implicit (you have to subtract two log lines on the receiver to compute it). The receiver does not get the response code or the upstream answer unless you also enable responses.
DNSTAP event (binary protobuf on the wire; this is what dnscollector decodes it to):
{
  "dnstap": {
    "operation": "CLIENT_RESPONSE",
    "identity": "ns1.darknetian.com",
    "version": "BIND 9.18",
    "latency_ms": 1.2,
    "peer-name": "10.42.1.7"
  },
  "dns": {
    "qname": "status.darknetian.com",
    "qtype": "A",
    "qclass": "IN",
    "rcode": "NOERROR",
    "length": 79,
    "id": 31337,
    "flags": {"qr": true, "aa": false, "rd": true, "ra": true}
  },
  "network": {
    "query-ip": "10.42.1.7",
    "query-port": 52310,
    "response-ip": "10.42.0.10",
    "protocol": "UDP",
    "family": "INET"
  }
}
~100 bytes on the wire (protobuf is compact), structured by construction. Every field is typed and addressable. The latency is carried in the event... the BIND daemon already had to compute it to send the answer, so DNSTAP just stamps it onto the record. No regex on the receiver; no second event to correlate; no missing-response-code blind spot.
The receiver-side ergonomics are the practical win as big as the appliance-side cost saving. Graylog/Elasticsearch/Loki/Vector all consume structured JSON natively; nothing in the pipeline has to parse a text log line and reconstruct the schema.
A nuance worth flagging: DNSTAP over a reliable stream connection treats the receiver as expected to keep up. If the receiver becomes unavailable, BIND's default DNSTAP behavior is to drop records rather than buffer them in the daemon. That's a deliberate trade-off: high-throughput telemetry tolerates loss far better than it tolerates back-pressure into the DNS service, but it means the receiver-side pipeline matters. If you care about not losing events during a Graylog restart, you build for that on the receiver, not on the appliance.
DNS-OARC and the Rest of the Capture Ecosystem
The reason DNSTAP isn't more famous outside DNS-operator circles is that it lives in DNS-OARC — the DNS Operations, Analysis, and Research Center, a non-profit founded in 2003 that hosts the long-running community of DNS root-and-TLD operators, registries, and large recursive providers. OARC's tooling and workshops are where the field has converged on "binary capture, structured records, off-box analysis" as the right substrate for DNS observability at scale.
The capture-layer toolchain DNSTAP shares space with:
- dnscap — OARC's
libpcap-based capture tool, predating DNSTAP, still useful when you need raw wire bytes (no daemon support required; works against any DNS server). - dnsjit — OARC's Lua-scripting engine for replay and analysis of captured DNS streams.
- dnstap.info and the reference implementations — the spec home and reference encoders/decoders.
The analysis/storage layer is a separate question. OARC ships dsc (DNS Statistics Collector), which consumes pcap or DNSTAP and emits XML-formatted aggregates; on top of that, OARC's hedgehog is the PHP web UI that visualizes dsc's output for the root-server and TLD operator crowd.
Outside OARC, the high-throughput-DNS world has spilled the same shape into general-purpose streaming-observability tooling:
- dnscollector — Go pipeline that ingests DNSTAP, PowerDNS protobuf,
dnsdist, pcap, raw syslog, and a bunch of other DNS-flavored formats, and forwards to whatever you actually want downstream (Elasticsearch, Loki, Kafka, plain JSON on stdout). This is what the homelab pipeline uses. - Vector (now Datadog-stewarded) — a general-purpose observability pipeline that includes DNSTAP and pcap source types alongside everything else; popular shape for ops teams that want a single agent for logs, metrics, traces and DNS telemetry.
- The PowerDNS recursor emits its own protobuf format (similar idea, different schema); large-anycast recursive operators (Cloudflare, Quad9) build internal pipelines around dnstap-or-equivalent for the same reason every other recursive deployment does.
- RIPE Atlas anchors, the probes that the measurement community runs as authoritative-side reference points, expose query streams the same way — high-volume DNS environments standardize on structured capture because the alternatives don't scale.
The recurring theme: every one of those tools assumes the DNS daemon either emits a structured stream directly (DNSTAP and its cousins) or that you capture packets off the wire (pcap). Nobody in this ecosystem treats text syslog as a per-query telemetry surface. Text syslog is for incident-shaped events (eg "here's a refused zone transfer") not for transaction-shaped events.
What the Cut-Over Actually Looked Like
The migration was additive, not destructive. NIOS syslog forwarding is category-scoped, the queries and responses categories are the heavy ones, but dhcp, security, update, zone-transfer, and the rest are all on the same syslog pipeline and all reasonable to keep. DNSTAP only displaces query/response logging; everything else stays on syslog where it belongs.
The commit landed the pipeline first, validated DNSTAP events were arriving (bridge: seen=N emitted=N failed=0 in the journal), then turned queries off on the grid. The DHCP path was the proof: 416 DHCP events in the 10-minute window straddling the cut-over, no gap. Same syslog pipe, different category, unaffected by the change.
The grid members themselves were the most obvious tell. Before the cut-over, the active recursives were running noticeably warm. Steady-state CPU dropped within the first 30 seconds of queries being disabled, and the journal's I/O wait disappeared from the next iostat sample. The dashboards that had been built against the syslog-derived query stream got rebuilt against the DNSTAP stream; same answers, more fields (latency, dnstap operation type, dnstap identity, dns_protocol), better-typed (numeric qtype instead of string "A"/"AAAA").
Things I'd Flag for Anyone Doing This
A few things worth knowing before pulling the trigger on a similar migration:
- The receiver-side capacity matters. DNSTAP drops on the appliance side when the receiver is unreachable. If Graylog is restarting, ingest queues are full, or the bridge process is back-pressured, the events go on the floor. For a homelab that's fine; for production, you'd put a queue between dnscollector and your downstream (
dnscollectorhas Kafka and NATS outputs that take that worry away). - The default Graylog index set's 1000-field cap is closer than you think. Putting DNSTAP on its own index set was not over-engineering. It was the difference between the next index rotation working and not.
dnscollector's stdout is mixed. It emits its own INFO/WARNING lines alongside JSON event lines. The bridge has to skip non-JSON cheaply;if not line.startswith("{"):handles 99% of the noise.
The Takeaway
Syslog query logging is fine for what it is: an incident-shaped substrate for occasional, text-readable DNS events. It is the wrong substrate for sustained per-query telemetry, and the cost of using it for that is structural (text formatting, file I/O, rotation, all on the hot path next to the recursive resolver). DNSTAP exists because the alternative (a binary, schema'd, off-box transaction stream) is what high-QPS DNS observability actually needs.
Spot a typo or want to suggest a change? Edit lands as a PR against the public mirror.